
Report Card of PM Justin Trudeau: The upcoming Canadian election, slated for 2025, is of paramount significance to Canada, as it signifies the nation’s choice for its Prime Minister. Notably, the two prominent political parties in Canada, the Conservative Party (CPC) and the Liberal Party (LPC), have unveiled their candidates for the Prime Ministerial position.
Presently, Justin Trudeau, the leader of the Liberal Party and the incumbent Prime Minister, confronts a formidable political landscape.
Justin Trudeau’s popularity has reached an all-time low, with only 38% approval. Recent polling data from Nanos indicates a troubling trend for the Liberal Party, which has lost 7% of its voter base, reflecting Trudeau’s declining appeal.
While Trudeau’s progressive policies and gender-focused education initiatives have sparked debates, the core reasons behind his unpopularity are more profound.
In this video, we’ll present data illustrating the consequences of Trudeau’s policies on Canada, and the outlook is concerning. It seems Canada is on a concerning trajectory with no apparent path of return.
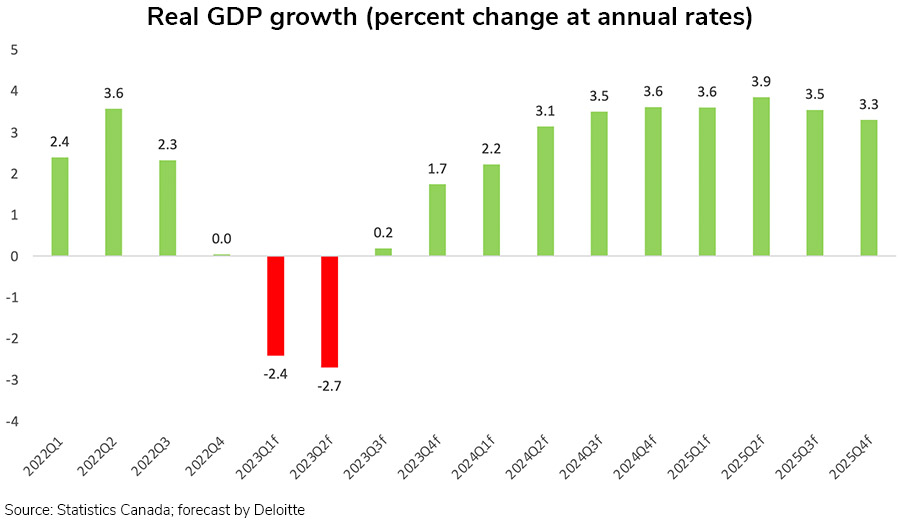
Report Card of PM Justin Trudeau: GDP Growth
Let’s analyze the GDP growth data for Canada from 2015 to the ongoing quarter in 2023 and analyze how the Canadian economy has been affected during this period.
In 2015, Former Canadian PM Steven Harper lost to PM Justin Trudeau. Since then, the trajectory of Canada has taken a nosedive.
In 2015, Canada experienced a modest GDP growth rate of 0.66%. The GDP growth rate improved slightly in 2016, reaching 1%. 2017 marked a significant uptick in GDP growth, with a rate of 3.04%.

The Canadian economy maintained strong growth in 2018, with a growth rate of 2.78%. GDP growth continued in 2019, albeit at a slightly slower pace. The rate of 1.89% suggests ongoing economic expansion, but it may have been influenced by global trade tensions and uncertainties.
The year 2020 saw a significant contraction in the Canadian economy, with a negative growth rate of -5.07%. This decline was primarily due to the COVID-19 pandemic, which led to lockdowns, reduced economic activity, and job losses. Yet, Trudeau’s fiscal policies played a huge role.
In 2021, the Canadian economy rebounded strongly, with a growth rate of 4.5%. This recovery was attributed to the end of lockdowns.
The strong recovery slowed in 2022, with a growth rate of 3.04%. As of the second quarter of 2023, the GDP growth rate is at 0.2% and heading into recession. Factors like inflation, supply chain disruptions, and global economic dynamics have influenced this slower growth.
The Canadian economy has experienced significant fluctuations in GDP growth over the past years.
Consumer Confidence
The Consumer confidence of average Canadians is also reaching record lows.
In 2016, the consumer confidence index was at 45. The index improved slightly in 2017, reaching 50. Consumer confidence continued to rise in 2018, reaching 55. However, in 2019, the confidence index dipped slightly to 52.
A significant drop occurred in 2020, with the confidence index plummeting to 35, primarily due to the COVID-19 Pandemic.
In 2021, consumer confidence began to recover at 47 but remained below pre-pandemic levels. The government’s response to the pandemic and vaccination efforts likely influenced this recovery.
The confidence index in 2022 showed further improvement, reaching 51. But, not for long. As of January 2023, consumer confidence has again plummeted to 37.
Factors such as inflation, supply chain disruptions, or poor fiscal policies have affected consumer sentiment.
The consumer confidence data indicates a rollercoaster ride for Canadian consumers, with optimism falling consistently under Trudeau’s regime.
Housing Index
Housing Prices in Canada have skyrocketed under Trudeau’s watch and it is clearly visible in Canada’s housing index.
In 2016, the index sits at 97, a reasonable base figure to consider. However, as we move to 2017, an uptick to 102 shows signs of an escalating market, making it slightly tougher for new home buyers to enter the market.
2018 doesn’t spare the common Canadian either, climbing further to 104.
2019 sees a slight dip to 103, but it is hardly a respite as it still indicates an elevated level compared to the initial years.
2020 marks a concerning rise to 105 amidst a global pandemic; a time when ideally, the government should have implemented measures to prevent such escalations to aid its citizens during such dire times. Instead, we see no slowing down, which hints at possible policy gaps or inadequacies.


2021 brings no relief, with a sharp spike to 115. By 2022, the index jumps to an alarming 122. At this point, a layman might view this as a clear indication of a government’s failure to keep the real estate market in check, paving the way for just elite class to afford homes.
In 2023, the trend unabating, climbs further to a staggering 126 (ongoing), transforming the Canadian dream into a nightmare for many. Here, one could equate this scenario to a game where the goalpost keeps moving farther away just as you think you are getting close.
Overall, the data portrays a bleak picture of escalating home prices year after year under Trudeau’s governance. His policies have failed to favor the average Canadian, instead seemingly nurturing a real estate bubble that threatens to lock many out of homeownership.
The Government Budget Balance
Prime Minister Justin Trudeau has frequently opted to increase Canada’s budget spending. Nevertheless, this increased allocation has often resulted in additional deficits for Canadians.
In 2016, Justin Trudeau presented his first-ever budget allocation of $312.5 billion, with a deficit of $19.0 billion. The government spent more money than it collected in revenue during that year.
The trend of deficit spending continued in 2017, with a budget allocation of $332.6 billion and a deficit of $19.0 billion.
While the deficit decreased slightly in 2018, it still existed, with a budget allocation of $346.2 billion and a deficit of $14.0 billion. Despite efforts to reduce the deficit, it remained a concern.
In 2019, the deficit increased significantly to $39.0 billion, despite a higher budget allocation of $373.5 billion. This suggests that government spending again outpaced revenue growth.
The year 2020 saw a substantial increase in both budget allocation and deficit. The COVID-19 pandemic led to extensive government spending on healthcare, economic relief, and support programs, resulting in a deficit of $354.2 billion.
In 2021, while the deficit decreased compared to 2020, it remained high at $90.2 billion. The government continued to allocate significant funds to address pandemic-related challenges.
The estimated deficit for 2022 stands at $110.0 billion, signaling ongoing fiscal challenges. The exact budget allocation for 2022 is not provided, but it is evident that government spending remains high.
It’s clear from this data that government spending in Canada has been consistently leading to deficits in recent years.
While Provinces like Alberta managed to maintain a budget surplus, the federal government’s budget dynamics have failed to do so.
Immigrant Intake
To fix the economy of Canada, PM Justin Trudeau introduced a more immigrant-dovish policy. Yet, no significant outcome has been rendered. Because rather than contributing to the nation’s growth, they have become a burden.
In 2015, Canada welcomed 323,192 new immigrants.
The number of new immigrants decreased slightly in 2016, with 272,707 individuals entering Canada. In 2017, the immigrant intake increased again to 303,325 individuals.
The trend of increasing immigration continued in 2018, with 313,601 new immigrants.
In 2019, there was a slight dip in the number of new immigrants, with 284,157 individuals coming to Canada.
The COVID-19 pandemic had a significant impact in 2020, leading to a decrease in new immigrants to 226,309. But, in 2021, Canada saw a substantial increase in new immigrants, with 491,306 individuals arriving.
Prime Minister Justin Trudeau announced a plan to bring in a high number of immigrants in 2022, with 431,645 individuals. This was an ambitious goal aimed at addressing economic needs and labor shortages.
The government’s plan for 2023 is to bring in 500,000 or more immigrants, indicating a continued commitment to immigration as an economic and demographic strategy.
Inflation Rate
Canada’s Inflation has been fluctuating ever since Justin Trudeau stormed to power
In 2015, Canada had a relatively low inflation rate of 1.13%. Inflation increased slightly in 2016 to 1.43%.
In 2017, inflation remained modest at 1.6%, a slight increase was now visible. In 2018, inflation increased to 2.28%. In 2019, the inflation remained at 2%.
In 2020, the inflation rate dropped significantly to 0.72%. This can be partially attributed to the economic impact of the COVID-19 pandemic, which led to reduced consumer spending and disruptions in supply chains.
Inflation surged in 2021, reaching 3.4%. 2022 saw a significant spike in inflation to 6.8%, the highest rate in recent years. This level of inflation was troubling for Canadians as it led to higher costs for essential items like groceries and housing, impacting household budgets.
The ongoing estimates for 2023 suggest an inflation rate of around 4%, which, while lower than 2022, is still well above the rates seen in earlier years.
High inflation can pose challenges for Canadians in managing their expenses and financial stability.
Read More: Bank of Canada’s stupidity will turn Canada into the fastest declining economy in the world
This data is enough to demonstrate why Canadians are growing tired of Justin Trudeau’s Government. His policies rather than aiding Canadians at a time of crisis are exacerbating the crisis for Canadians even more. This makes it more likely that he is set to lose the Prime Minister’s office in 2025.
References